
by Jack
California now has over 1/3rd of the entire welfare population in the nation living right here! But, take heart, this won’t affect our unemployment numbers..no, no, no. Our smoke and mirrors reporting methods will make sure you don’t notice how bad it really is. Welfare recipients are considered employed for statistical purposes and that’s how we’ve kept the awful truth from you. Unemployment and underemployment in CA is a disaster as big as welfare. (Being on welfare is a job now? Only government could come up with that one.)
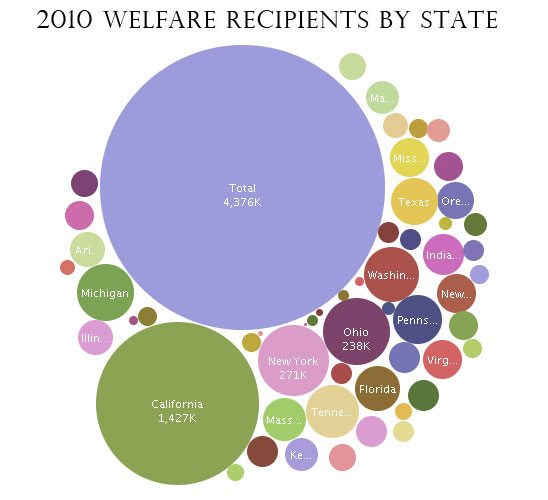
Updated for 2013: 34% Of the nation’s welfare recipients live in California but only … 12% of the U.S. population resides here.
Fun facts to amaze your low information voter friends…
• Ca pays out one of the highest maximum monthly cash grants to the average family on welfare, $638.
• Continues aid for children even when the parents lose eligibility.
• Provides benefits even to some who find a job and helps with child care and transportation while attending school or training.
California is third among states in per-capita spending on welfare: $179
New York leads the nation: $256, (but if CA wasn’t broke, I’m sure we would lead the nation here too.)
Myth: Most welfare recipients are on benefits a short time.
At any one time 80% of any given caseload is chronic, repeat for one or more lifetimes.
80% of the money being spent at any one moment in time, is for the chronic, constantly needy, needy by choice, more than circumstances. The other 20% comes and goes on a regular basis, in one door, out the other, never to be seen again.
At any moment in time, only 20% of the total, but over a long stretch (say five years), most of the ones helped were short timers, came and went, just like the myth says, most of the recipients on a short time,. . . . . . . but they only use 20% of the total funds available. 80% of the financial help available, goes to those ‘few bad apples.’ That does not sound like a good taxpayer investment to me. It seems to me the lion share of the money should be spent on the temporarily poor, the poor by circumstances, more than choice. http://www.urban.org/publications/900288…
| USA Percent of recipients who are white (69.13% of the total US pop. yet only represent 38.8% of those on welfare) | 38.8 % |
| USA Percent of recipients who are black (12.6 of total US pop. are over 300% more likely to be on welfare than whites) | 39.8 % |
| USA Percent of recipients who are Hispanic (12.55 of total US pop. are 150% more likely to be on welfar than whites) | 15.7 % |
| USA Percent of recipients who are Asian (3.6% of the total US pop. are less likely to be on welfare than any other race) | 2.4 % |
| USA Percent of recipients who are Other (.17% of the total US pop.) | 3.3 % |
- 1 in every 3 blacks are on welfare.
- 1 in every 56 whites are on welfare
- 1 in every 12 Hispanics are on welfare
These are the facts – feel free to use them to win arguments with liberals.